QGIS Overview
![]()
What is QGIS?
QGIS is the best GIS tool in the free and open-source software (FOSS) community.
QGIS is a user friendly Open Source Geographic Information System (GIS) licensed under the GNU General Public License. QGIS is an official project of the Open Source Geospatial Foundation (OSGeo). It runs on Linux, Unix, Mac OSX, Windows and Android and supports numerous vector, raster, and database formats and functionalities.
Here’s a link to download QGIS
Explore QGIS:
For a more thorough explanation of QGIS, see the QGIS User Guide here.
The Basics
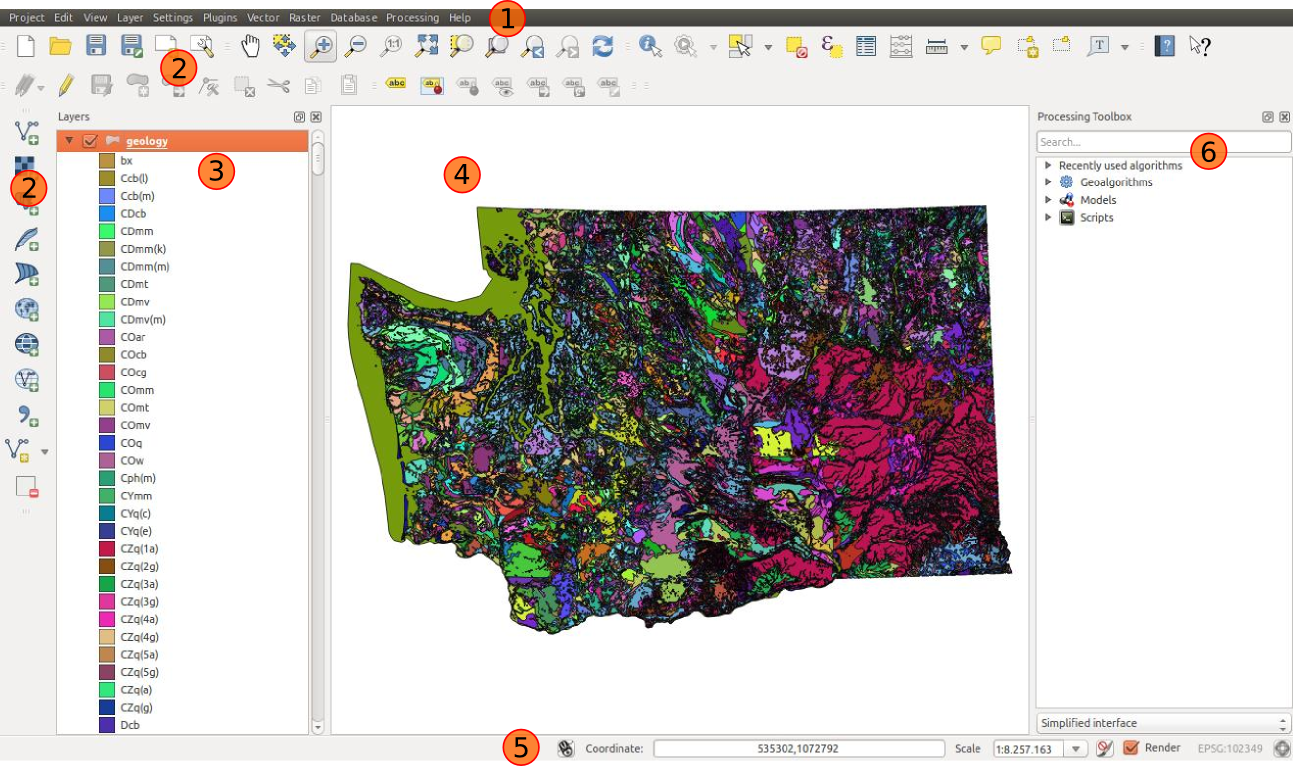
- Menu Bar The menu bar provides access to QGIS features. In Linux systems, hover over to view menu bar options (haven’t checked other systems). The QGIS version is displayed while not hovering over the menu bar (linux systems). Most common features or tools are accessable through the toolbar icons which will be the prefered method throughout this QGIS introduction.
- Toolbar The toolbar provides access to most standard QGIS functions. Go to Menu Bar > View > Toolbars to activate or deactivate toolbars. Hover over tools to view the description and puropose.
- Map Legend The map legend is a list of all layers in the project. Each layer can be turned on or off with the layer’s checkbox. It’s possible to group layers.
- Map View The map view displays the active layers in the map project. You can set the map view extent by right-clicking on a layer and selecting Zoom to layer extent
- Status Bar The status bar displays current position in map coordiantes (e.g., meters or decimal degrees) as the mouse pointer moves across the map view. To the left of the coordinate display is the button gor toggling extents and mouse position display. To the right of the map coordinates is the scale, which may be set to one of the predefined zoom extends of 1:500 to 1:1,000,000. This scale setting will adjust as you zoom or pan throught the map view. Options for map rendering are to the right of the current map scale setting. To the far right is the current CRS for the map project.
- Processing Toolbox The processing toolbox must be turned on by naviagting to Menu Bar > Processing > Toolbox. This helpful tool allows searching by keyword for the geoalgorithm from each of the active processing roviders.[^2]
Configure your workspace
Project properties
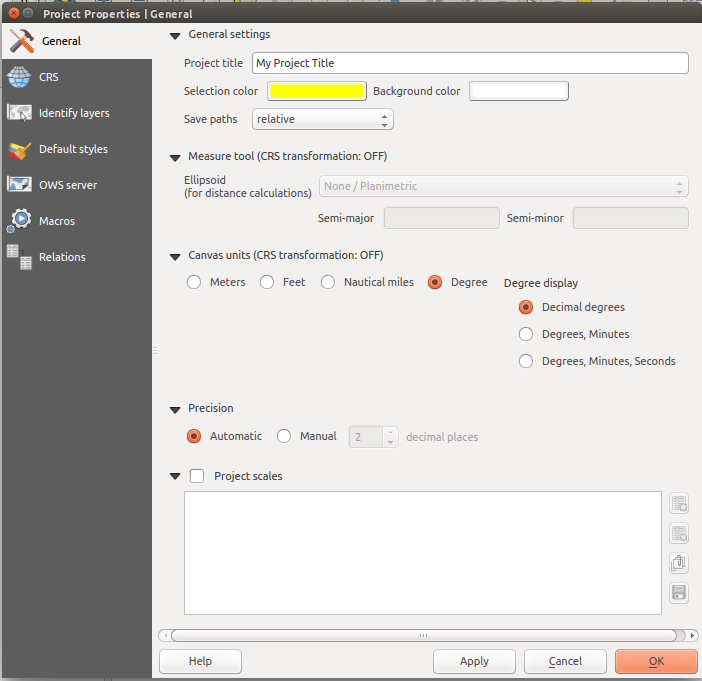
Menu Bar > Project > Project Properties
From here you can set the title, save relative paths (default!), set canvas units, enable on-the-fly projection, etc. On-the-fly projection will project layers added to the project to the configured projection.
Activate necessary providers
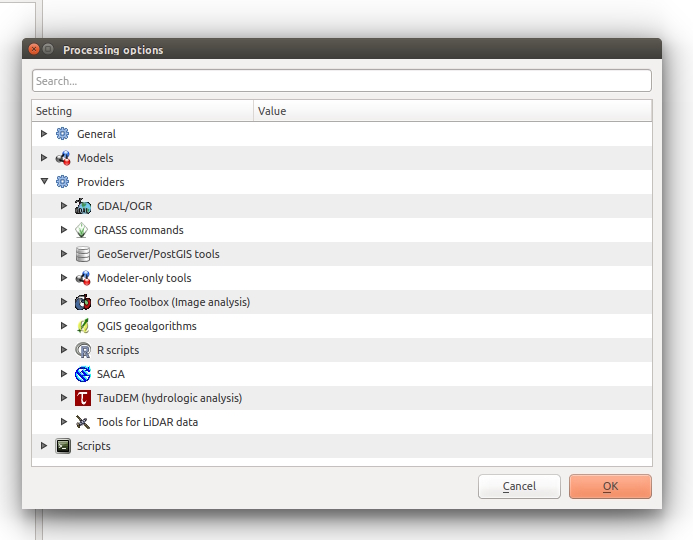
Menu Bar > Processing > Options and configuration > Providers > $PROVIDER > Activate (be sure it’s checked)
See the complete list of processing providers and algorithms here
Working with Project Projections
QGIS allows users to define a global and project-wide CRS (coordinate reference system) for layers without a pre-defined CRS. It also allows the user to define custom coordinate reference systems and supports on-the-fly (OTF) projection of vector and raster layers. All of these features allow the user to display layers with different CRSs and have them overlay properly.[^2]
See Intro to Spatial Data for more detailed info on projections.
Each new project starts with the global default projection, EPSG:4326 - WGS 84:
proj=longlat +ellps=WGS84 +datum=WGS84 +no_defs
This can be changed at Menu Bar > Settings > Options > CRS > Default CRS for new projects
However, this is not the same as changing the project projection. You may define the project projection from Menu Bar > Project > Project Properties > CRS. Also keep in mind, the CRS of a new project will change to the CRS of the first layer added to the project.
‘On the fly’ CRS transformation is not enabled by the default QGIS installation.
Supported Data Formats
QGIS support a multitude of data types from simple shapefiles to database tables to Web Feature Service layers. Sticking to the basics, below are quick descriptions of vector and raster data.
Vector
QGIS uses the GDAL OGR library to read and write vector data formats, such as the most commonly known ESRI shapefile. GRASS vector and PostreSQL support is provided by a native QGIS provider plugin[^2]. Here is the complete list of OGR vector formats.
Vector data is added to the project by simply clicking on the Add Vector Layer tool:
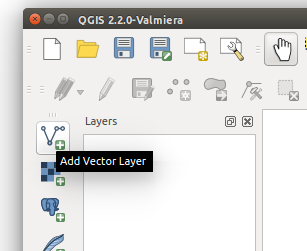
View vector attribute table by right clicking on the layer and clicking Open Attribute Table. From here you can sort data, show selected features, show features visible on map, show edited and new features, filter by column, or query data with and advanced filter.
Attribute data can be edited by enabling and edit session with the Toggle Editing Mode icon (top left).
Raster
QGIS uses the GDAL library to read and write raster data formats while GRASS raster support is provided by a native QGIS provider plugin[^2]. Here is the complete list of GDAL raster formats.
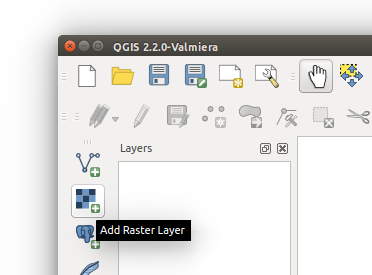
Similar to adding vector data, click on the Add Raster Layer tool:
General Spatial Functions
Spatial functions are accessable through Menu Bar > Vector/Raster. Or alternatively, they are accesses through the Toolbox panel where searching for tools by keyword is made easy.
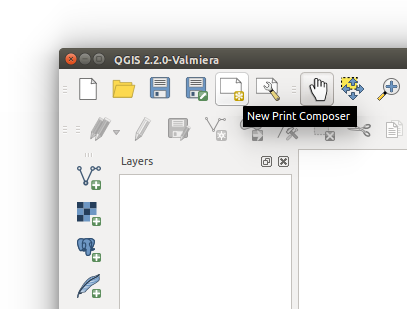
Composing Maps (for print/non-web-based)
This method is ideal for exporting your work for a research paper, admiring your work, and such. Developing a web map for dissimenating your data is a bit more involved and is discussed in the Publish Your Data to a Web Mapi/LeafletJS section. Also, to export data with styles see This section link.
Begin by opening the Print Composer: