Compose a map
Exercise
Objectives
- Create a print-based (static, non-interactive) map in QGIS.
Procedures
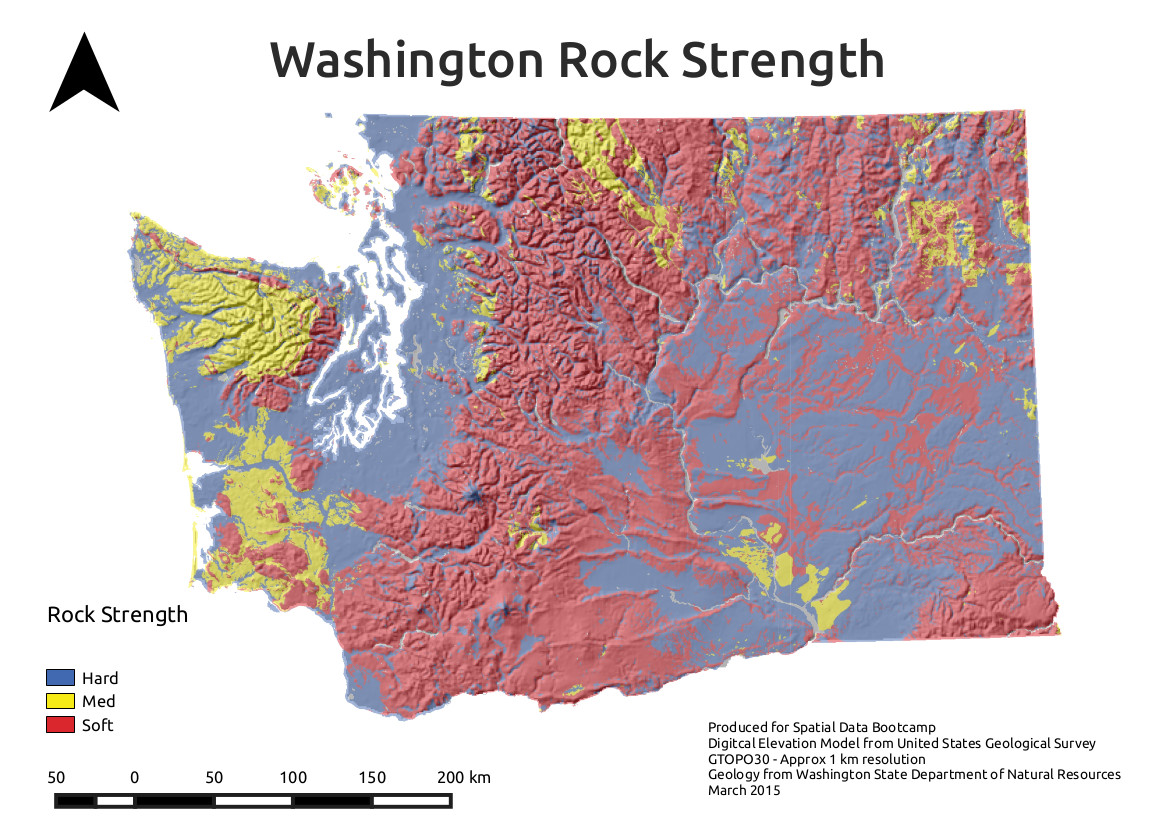
Create map of Washington rock strength
Layers needs:
- geo_coded.tif
- dem-washington.tif
Prepare data for map
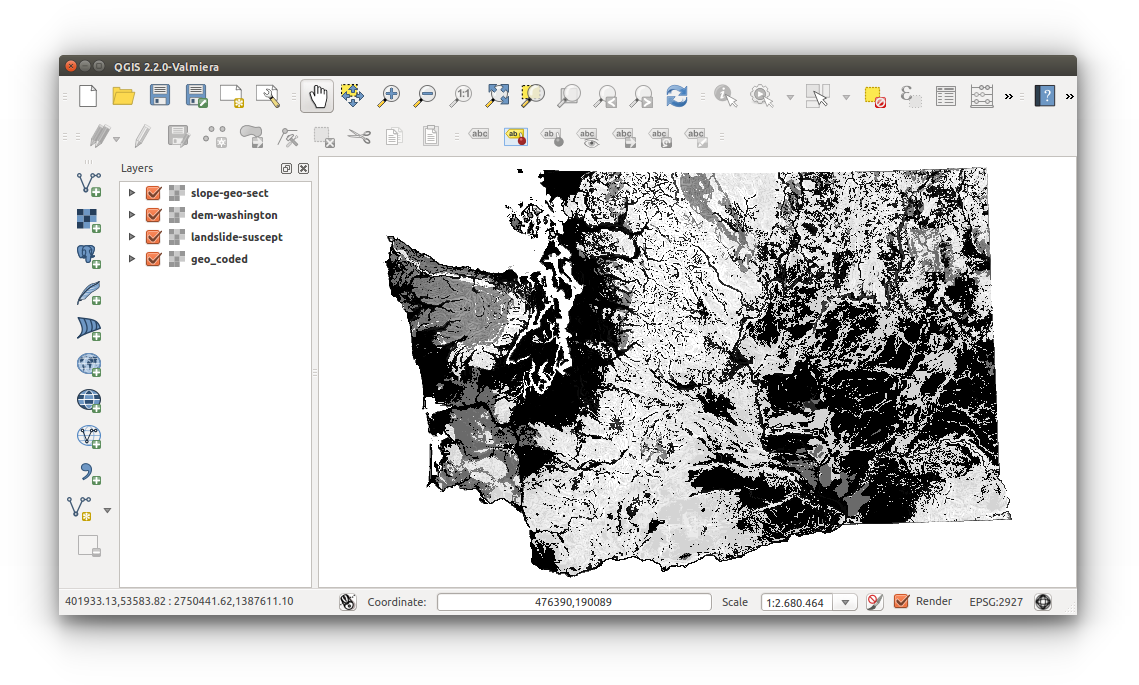
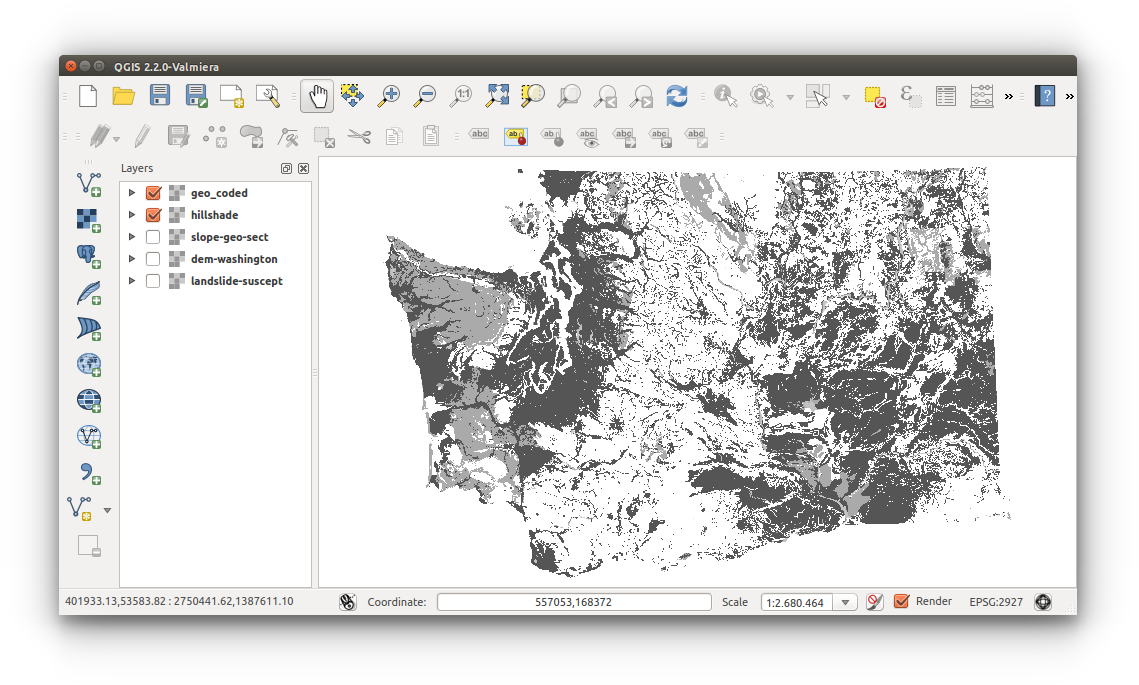
- Uncheck all layers, less dem-washington and geo_coded
- Load hillshade-washington.tif
- Be sure geo_coded is moved up, or on top of dem-washington:
- Click-hold-drag geo_coded to the top of the layer list.
- Uncheck dem-washington layer.
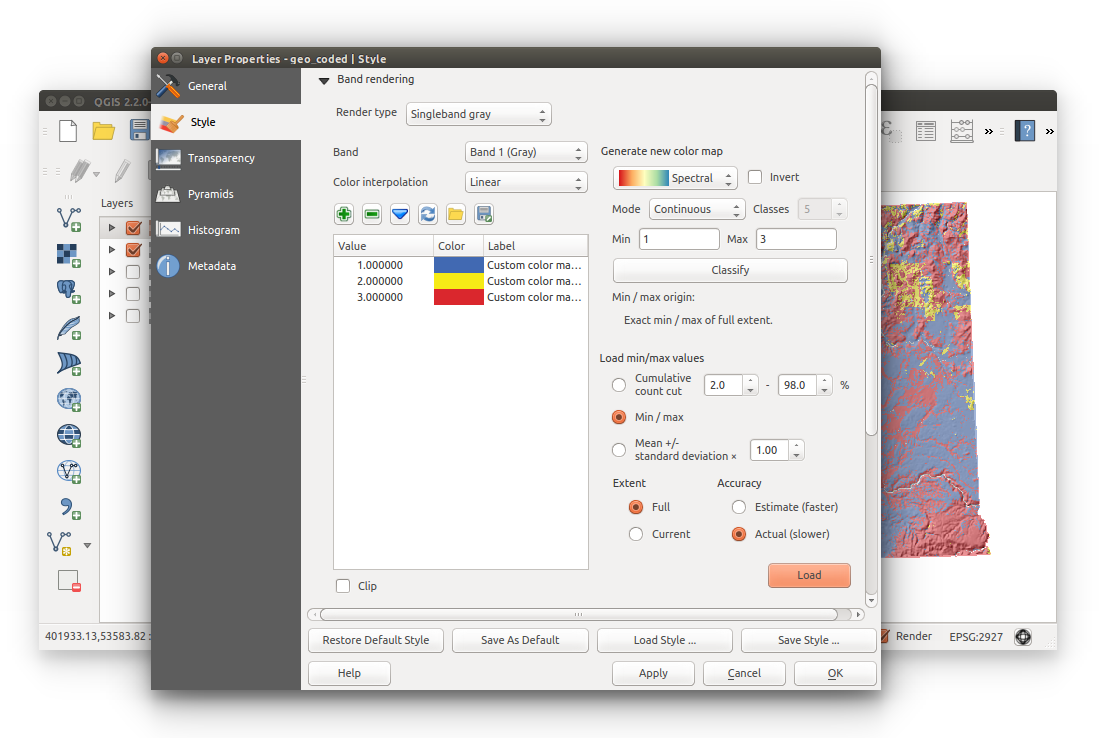
- Style geo_coded with qml-style file:
- Right-click geo_coded > Properties > Style
- Load Style… (button at bottom) > Navigate to rock-strength.qml
- QGIS does not load actual minimum and maximum values by default. This enables faster layer rendering. You’ll want to load actual min/max values to visualize the correct data. To load actual min/max values:
Load min/max values: Min/max
Accuracy: Actual (slower)
Click Load
Click Apply to save changes
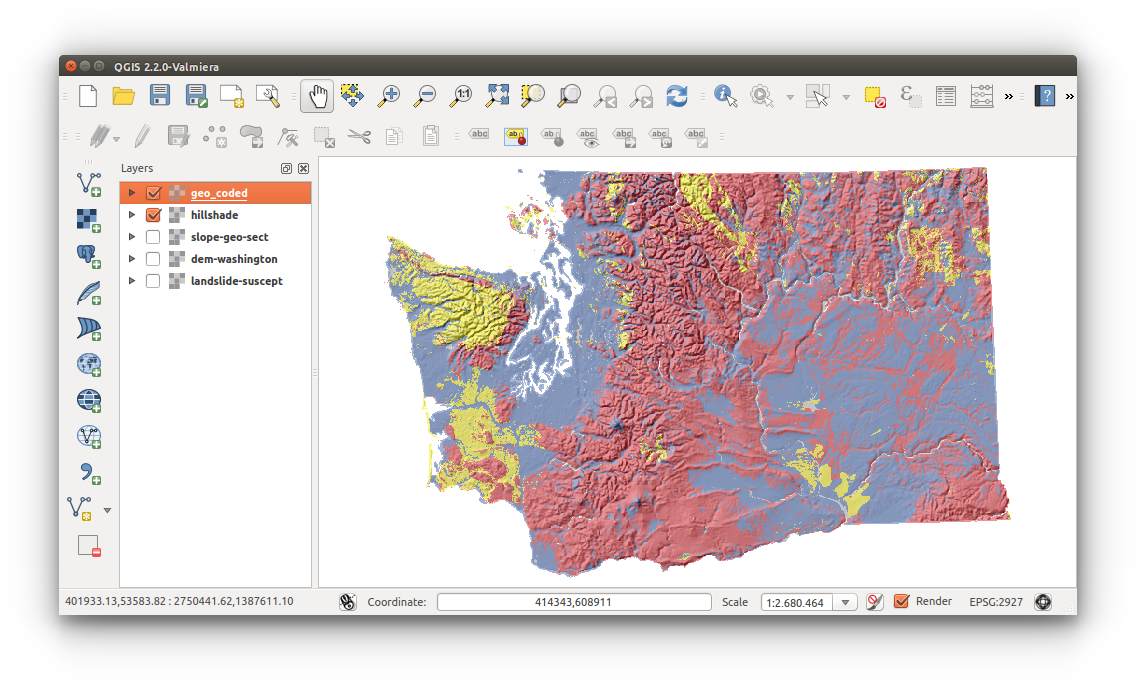
- Increase transparency:
From within layer Properties > Transparency > Global Transparency > 50%
Click Apply, OK to save changes and close Properties - The product just created visualizes rock strength within Washington state with enhanced effects using hillshade and transparency.
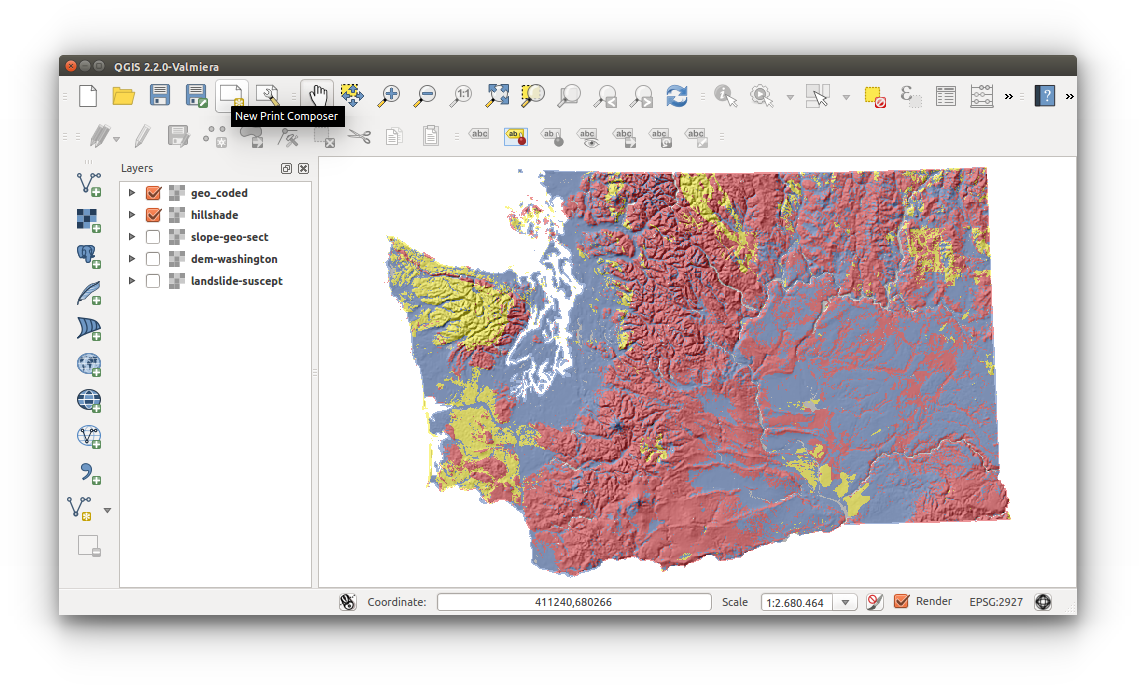
Making the map
- There are several was to open the Print Composer:
- Menu Bar > Project > New Print Composer
- Print Composer toolbar icon
- Create title:
- This new Print Composer project will be saved and can be accessed through the Composer Manager.
- The Print Composer opens in a new application window, you will still be able to work in your current project while making a map.
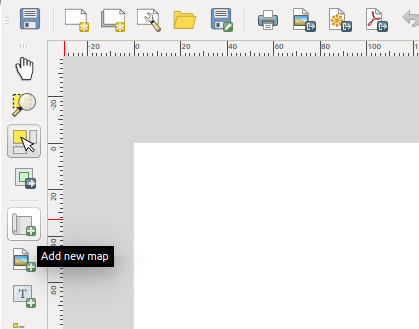
- You must add a map layer for visualizing. The Add Map tool will require you to create a bounding box to fit the map. Adjust the bounding box as needed. To add a map layer:
- Menu Bar > Layout > Add Map OR
- Add new map toolbar icon:
- Move Item Content tool will allow you to move the map without moving the bounding box
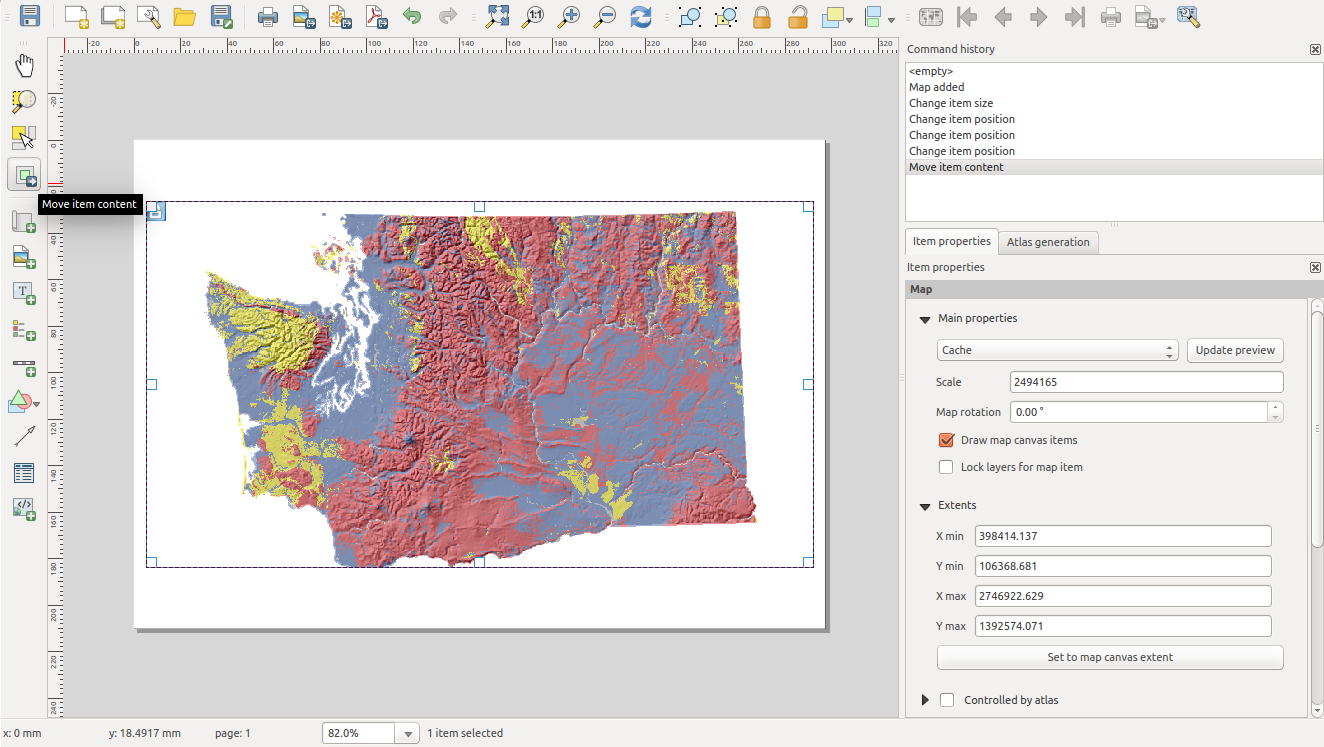
- Explore tools by hovering over the toolbar icon or go to Menu Bar > Layout to see the names of each layout tool.
- Add a legend:
- Menu Bar > Layout > Add Legend
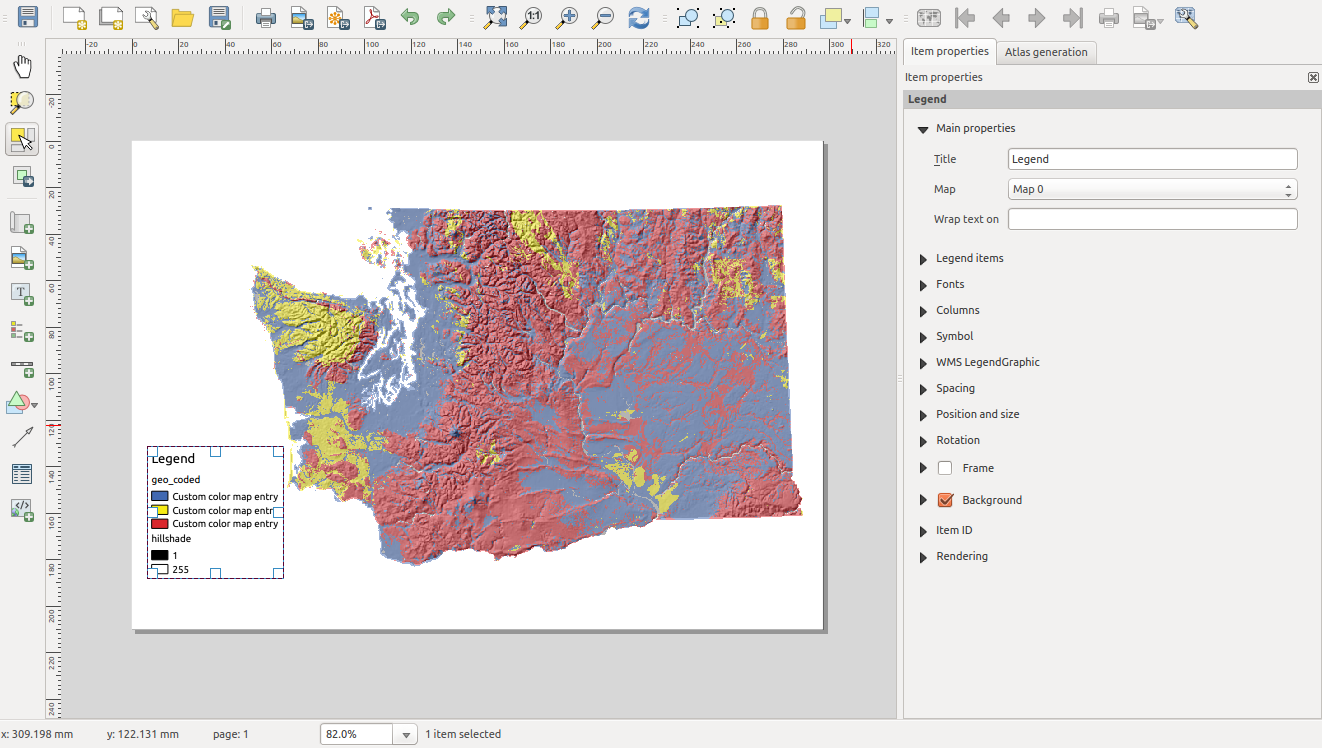
- Notice how names and values are not appropriate for a final map. To open legend propertie, using the Select/Move Item tool: Select the legend layer and notice the Item properties on the right
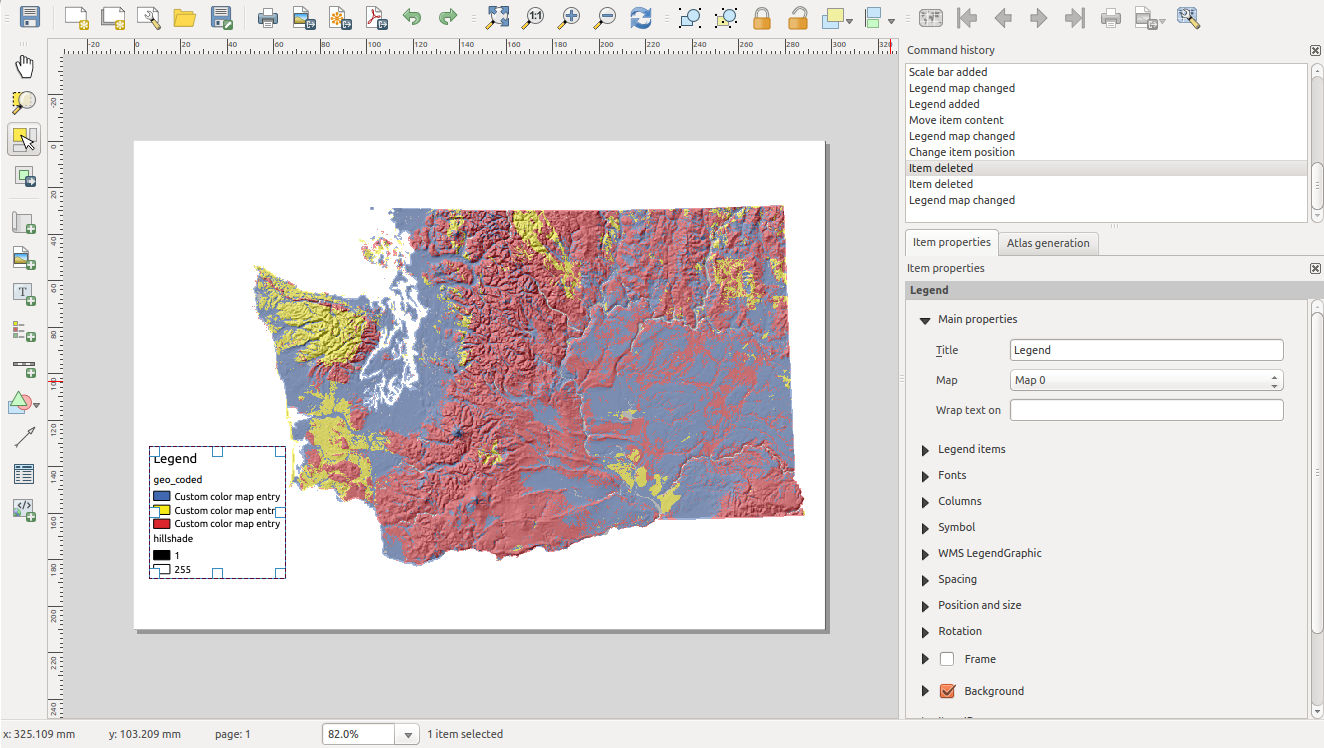
- Item properties: Here you are able to change the title, select which legend to produce based on the map layer, modify legend item, etc. See the images below for the list of options.
- Add a title:
- add title
- Add scale bar:
- scale bar
- Map info
- map info
- North arrow
- Menu Bar > Layout > Add image then click area on map.
- Image item properties > Search directories > Locate North Arrow
- Configure additional features
- Export map:
- As Image, PDF, or SVG.
- As Image, PDF, or SVG.